Litter Index Overview
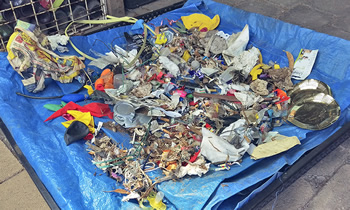
KESAB Staff "Walk the Block" lunch time litter pick up
The KESAB Litter Index shows the types of litter and different site types where littering occurs, providing South Australia with an indicator of trends relative to any increase or reduction of litter pollution.
Data allows KESAB, and participating program Partners, to identify appropriate education and engagement strategies to underpin our continual efforts to influence change in response to the combination of lightweight disposable packaging and poor behaviour by consumers that impact on the environment.
The Litter Index records both item and estimated volume across 151 sites throughout South Australia (84 Metro, 67 Country) in May and November each Year.
The May count is used as the benchmark for the purpose of the KESAB Annual Report.
Sites and types of litter are counted across an area of 1,000m2 by trained litter counters working to specified procedures and reporting practices. Sites are regularly reviewed in context of category and physical changes which may impact on data consistency (e.g. new highway, shopping complex, building development converting use of open space to residential).
Litter is observed and counted, but not picked up thereby reflecting the natural elements of wind, rain events, fire or council and community clean ups. The Litter Index has the flexibility to add new controlled data sets, such as pick up, identifying branded litter, adding new sites or focusing on specific littering or pollution issues (e.g. illegal dumping or roadside litter blackspots).
These aspects are currently being considered by an independent CSIRO review in collaboration with Green Industries SA, KESAB, KABN and jurisdictional partners.
The KESAB Litter Index is increasingly important and is the only longitudinal litter by count and volume in South Australia.
The KESAB-developed count methodology facilitates the National Litter Index and Branded Litter Study which is conducted in collaboration with the Keep Australia Beautiful National Association.
This Annual Report also includes details of the ‘Dob in a Litterer’ (DIAL) summarised data for the period February 2017 – June 2018. At the time of preparing this report the EPA was considering the future of DIAL due to budget impacts.
Litter at a Glance
Litter in South Australia has reduced during the period May 2017 and May 2018 (total items reduced from 9,354 to 7,504 items). This represents an overall litter reduction of 19% during the period.
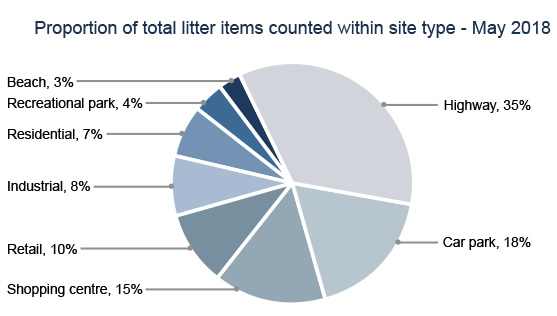
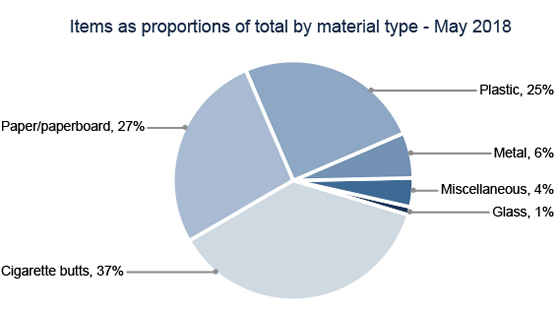
Cigarette butts continue to be the most littered item (37%), and highways are the most littered sites (35%).
During the period, considerable focus through ‘China Sword’ and War on Waste impacts have respectively highlighted both litter and resource recovery issues on many items identified through KESAB Litter Index trend analysis. These include plastic straws; take away coffee cups, plastic bags, bottle tops and illegal dumping. KESAB future campaign and education development focus will include targeting these issues.
Litter Index Wave Reports
For KESAB Litter Index data set click on: www.kesab.asn.au/councils/litter-research
Education, Campaigns and Enforcement
KESAB litter awareness and education activities implemented during the period include Litter Less schools program and BAZZA the Bunyip travelling road show through the Riverland and Murray Lakes Regions.
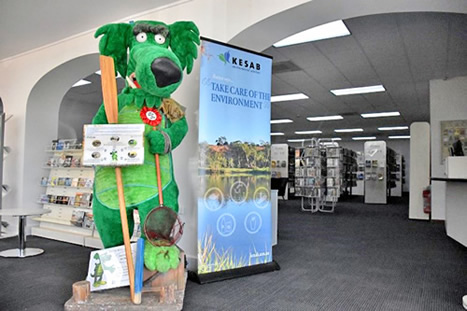
Bazza stands proud welcoming visitors at the Renmark Library
